As spring is upon us, bringing welcomed warmer weather and longer days, many are contemplating what normality will look like in the coming months. There is strong hope that as an increased amount of the population becomes vaccinated, the US will be awarded a downed sloping contagion curve. While this is true, there are also worrisome signs that the fourth surge of contagions spurred by the B.1.1.7 variant might also be on the horizon, making the situation a race to vaccinate in large numbers in order to avoid the worst impacts of this latest wave of the virus. Anxious eyes look to their calendars wondering when it will be safe and reasonable to start making social plans. The rollout of the vaccine in the US is gathering momentum and many people have already received an injection or plan to do so in the near future. Studies show that once a person is vaccinated not only are they less likely to contract a serious case of COVID-19, but they are also less likely to spread the virus to others. This is very encouraging news and much of what normalcy will be like hinges on the rate at which countries vaccinate their populations.
Once large sectors are the population are protected, the virus will be limited in its capacity to spread through herd immunity. This will enable governments to ease social restrictions, allowing the economies to reopen and for people to return to more habitual activities, albeit while practicing caution. Given the importance that the vaccination process has for governments and their citizens, it is critical to track the progress using carefully gathered statistical data. This information once tabulated and filtered can be used to drive dynamic world maps to show the rate of vaccinations in real-time and compare the results amongst nations and within regions of specific countries.
In this article, we will look at the following topics:
-
Combining real-time data with dynamic maps
-
Using world maps to plan travel and reduce restrictions
Big Data and Granular Mapping at the World Level
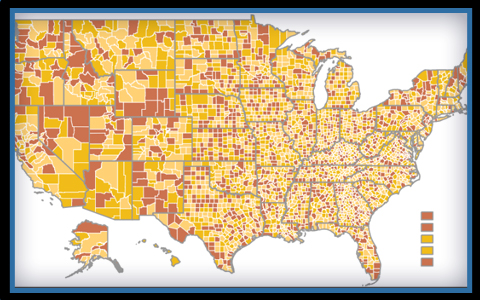
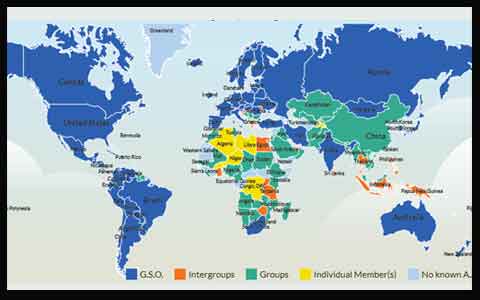 With the goal of providing a mechanism to display real-time statistical data in an interpretable and easily presentable fashion, dynamic world maps can be paired with vaccine data tracking sources and configured to populate from the same backend databases. Information is often gathered at the National level, which is helpful for drawing comparisons amongst nations but is limited in providing useful statistics to the population. To this end, using more granular State, County, or municipal level maps, can be much more constructive. Projects can be configured to contain multiple views, each called through a simple dropdown filter so that viewers can choose whether to view aggregate statistics at the national level or hone in on subdivisions of a specific country. These multi-level maps are powerful tools for transmitting vaccination tracking reports to a community. The same map can show aggregate values at the Global level while also offering a comparison of information within States or Counties. Vaccination sites commonly collect the basic contact information for all treated individuals, including their home addresses.
 The individual data is kept private, but the address location can be assigned to a municipality or county so that the information is only tabulated according to this based division. Once each vaccine dose is assigned to the smallest division on the map, it is simple for the software to tally the values for all parent layers. The possibilities for using the software are multifold, including building a system of filters to define specific criteria on the maps, whether by date range or future projections. Since vaccination sites are already collecting the data, feeding this information to dynamic world maps would only involve connecting the map software to the backend databases. Once set up, the maps automatically refresh as new data is appended and information can be easily exported for presentations, both in a tabular form as well as high-resolution PNG files. The Dynamic Maps can inform viewers within the embedded website, as part of the goal of tracking progress and managing expectations within a community.
Relaxing Social Distancing Measures Using Dynamic World Maps
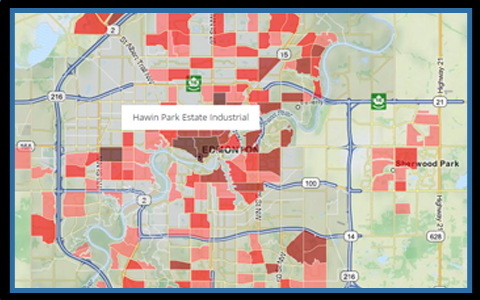
 The goal for governments and the long-anticipated hope for citizens is that once a significant percentage of the population is vaccinated, the transition from imposed social distancing to more relaxed cautionary measures can begin. This shift will likely begin with the lifting of travel restraints in order to launch the tourism sector in time for the summer season. Yet as we see currently unfolding, the rollout of the vaccine is not progressing at the same rate across the developed world. The speed at which countries are able to successfully secure vaccines and administer them to their populations has fluctuated widely. As data is gathered, this information can be monitored using Dynamic World Maps and once specific countries cross a favorable threshold, maps can be configured to color code regions accordingly, providing viewers with a quick reference as to areas of most secure travel. This can be accomplished at the global level for international travel, but also applied to regions of specific countries by expanding the cartography to include sub-divisions by Province/State. This would benefit travelers as they plan their itineraries to concentrate their movements in areas with a higher level of vaccination, which in turn would most likely mean lower levels of social restrictions. The custom maps can be dovetailed with any type of administrative division, such as townships, as long as there is data to support this level of tabulation. For example, overlays can be applied on OpenStreetMaps to define specific districts within a city or townships within a County, which then could potentially show the percentage of residents who have been successfully vaccinated within this specific area. Policymakers can turn to these types of software tools when forecasting new guidelines and maximizing the efficacy of the vaccination campaign.
There is a lot at stake in securing that the World is able to work together to provide a successful and equitable vaccination program to all citizens. Accurate data and the implementation of new software, including Dynamic World Maps, can be employed to serve this purpose and inform the general population. Please contact jQueryMaps with any questions on future mapping projects.
Share the post "How Dynamic World Maps Can Track the Pace of Vaccinations"