In this blog article, we will be looking at some ways that technology and big data can be integrated with maps to provide powerful systems able to help analyze the impact of climate change. Custom software tools offer insights on what measures are most effective to mitigate adverse effects on our planet. We have already seen how unusually pronounced droughts in one region contrast with devastating floods in others, supporting the common belief is that weather patterns are becoming more extreme. Scientists estimate that there is a tipping point beyond which it would be very difficult to reverse path, and we are quickly approaching this mark. Many estimates predict that in order to pull back from the precipice, global temperatures must not exceed 1.5°C above preindustrial levels. This requirement presents a difficult task to cut world emissions by 2030. As governments start to acknowledge the risks, we now see large scale studies drive new innovation and legislation. The data that is produced in these studies can work with interactive maps to give users and scientists different perspectives and options to interpret what is occurring on our planet. There are many ways to create such custom maps, and in the article below we propose ideas from past projects.
In this article we will look at the following topics:
-
Custom Maps of Water Temperature Changes
-
Mapping Air Quality and Variations with Historical Data
-
Interactive Maps Highlighting Impactful Events
Employing Big Data and Interactive Maps to Analyze Ocean Temperatures
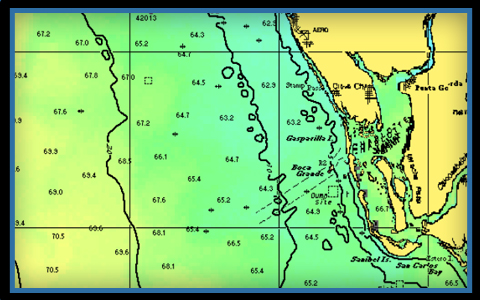 A key source to our success in combating climate change is the ability to effectively leverage technology to make impactful changes. The ability to amass large amounts of data has never been easier and applying the right resources and metrics can give scientists insight on what measures are most effective and need to be applied most urgently. The rise in ocean temperatures is one factor that is staggering in its consequences and already impacting many communities. As oceans warm, the rate of polar ice cap melting is increased exponentially, causing a rise in water levels that threaten many island regions in addition to major coastal cities. The greenhouse effect of carbon emissions is also warming the ocean at a rate far faster than previously anticipated, jeopardizing coral reefs and entire species of marine wildlife. The impacts of these complicated phenomena are hard to predict, but more powerful ocean storms, beach erosion, and depleted reefs that many are witnessing are an indication of what may be in store. In order to make sound decisions and provide solutions for the future, scientists need to rely on accurate data. At jQueryMaps we have worked with clients to create tools to better display ocean temperatures. These products use existing oceanographic maps as sub-layers, which highlight features such as water depth or underwater landmarks. The maps then pull information collected from ocean buoys and satellites to assign temperature ratings to a specific set of coordinates. By arranging many data points together, the software produces an accurate map of the ocean surface temperature and variances between coordinates. Different temperature ranges are assigned a color according to a predetermined pallet in order to create a heatmap layer of the ocean surface. As the data is refreshed in real-time, the maps update immediately to account for any changes. The historical data can always be stored at specific points to be later called through a system of filters. This provides the ability to show changes over time and draw important comparisons. Solutions such as this help give tools to scientists and decision-makers to help guide new policies.
Creating Maps to Track Air Quality
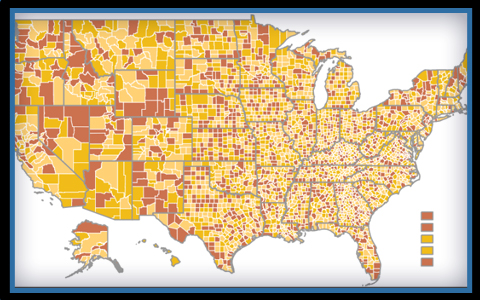
 One unexpected consequence of COVID-19 is the significant drop in CO2 emissions throughout the globe. The combination of reduced manufacturing and curbed travel has provided glimpses of how even a short hiatus in global production can greatly impact air quality. Of course, no one subscribes to the idea that it is feasible or desirable for such a dramatic situation to continue, but hopefully, scientists can learn from this experience and build theories that will assist in mitigating climate change. Since studies are largely based on air quality tests linked to a specific location, it is possible to collect the results of these tests and assign coordinate values. This provides the blocks for creating interactive maps to analyze data in a more visual format and extract conclusions that might be harder to detect from simply observing tabular results. Similar to the methods used to create ocean surface temperature maps, air quality samples can be plotted and assigned a color based on pre-established ranges. The software then produces a heat map as an overlay to an existing base layer to show the transitions in data over an extended geographical area. More features can be built into the system to allow for the individual plot markers to become selectable for in-depth analysis.
 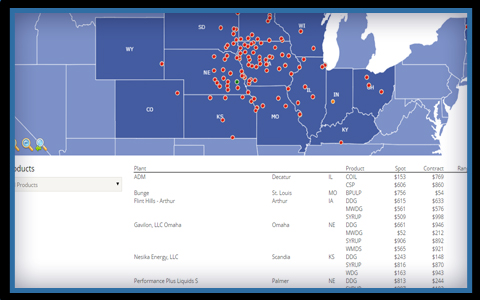 This can be further extended by implementing filters that enable users to show specific results based on value, location, or time period. Interactive maps can also be printed to PDF and made to include a result table for immediate presentation material. The goal of combining accurate data and powerful mapping software is to create systems to analyze information and produce insights to test new theories.
Showing Pivotal Events on Dynamic Maps
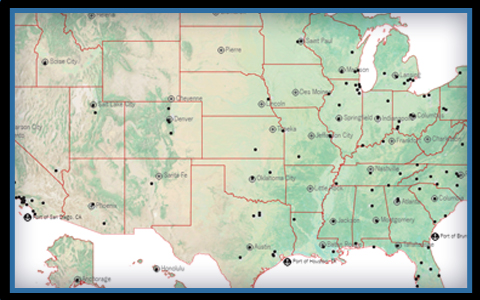
 Aside from serving as a powerful comparison and analysis tool, interactive maps can also be configured to show pivotal events in the effort to curb human influence on climate change. These types of maps can be shown on websites, intranets, and even printed to use as part of brochures, newsletters, or other circulations. Features of the maps would be highly customizable to provide a unique look and feel, including personalized icons, backgrounds, tooltip boxes, and overlays. These projects would be specific to the type of data used to power the map. One such project that jQueryMaps created was an application to show the location of windmills across the US where individual structures were color-coded based on the amount of energy they produced. This gives an impression of the arrangement of the windmills in a region, showing areas that are taking the most advantage of this form of renewable energy, while also pointing users to the locations that are most productive. Adding filters to quickly turn on and off datasets then gives users the ability to explore the data at a much more granular level. Information for any map would need to be associated with lat/lon values or a geographic area, however, the specific goal of the project would dictate whether it is beneficial to show the data as individual points or aggregate values within a region. For some projects, it is more impactful to show the scattering of data points, but depending on the quantity of information and the type of content, it can also become distracting to users. A useful approach would be to build an interactive map with a streamlined initial view that encourages users to apply filters to turn on more complex features.
At jQueryMaps we welcome your ideas and are eager to share our years of experience in the field of interactive maps. Contact us for a no-commitment 30-minute consultation.
Share the post "Software and Interactive Maps to Monitor Climate Change"