As the world rebuilds from the humanitarian and economic loss produced by the pandemic, societies are aware that the world stands at a unique crossroads. On one hand, reconstruction efforts can largely follow the existing models of economic growth and prosperity, using current systems as blueprints to recreate what we had prior to the onslaught of COVID-19. Alternatively, many scientists, academics, and politicians are inclined to galvanize the suffering from the pandemic to rewrite the stands for an economic model that is much more aligned with the environment, sustainability, and social well-being. In many ways, the gravity of the pandemic, with far-reaching effects across all industries, was a forewarning that we are fragile and science and planning can protect us only so far when dealing with the power of mother nature. Environmental scientists have long harped warnings of what might come should pollution levels not change, however changing course often finds friction unless it is provoked by some greater condition. Now that we stand in that unique position, the world must make sound and long-term decisions that will mark the path for decades to come. These decisions, stemming from complex scientific data, are carved into policy and must be effectively communicated to the population in order to be accepted. Custom mapping solutions combining scientific data and georeferenced maps are customizable and highly scalable to show information at the World level as well as within specific communities.
In this article, we will look at the following topics
-
Using Custom Maps to Build Forecast Models
-
Showing Multiple Levels Within a Single Map Project
Combining Big Data with Custom Mapping Solutions
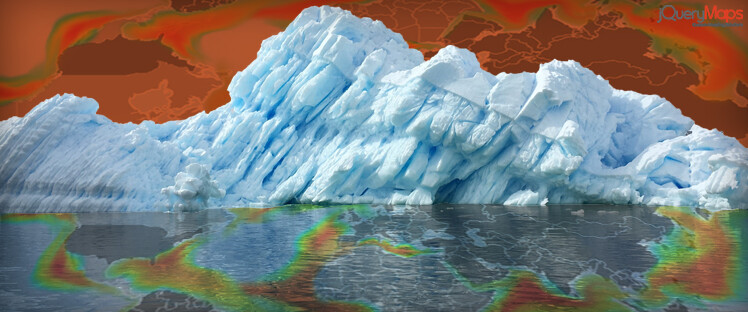
![]() The scientists that build complex forecast models use numerous data metrics to compute predictions around climate change. These include increases in air temperature, water temperature, the concentration of gases in the atmosphere, and water levels, to name a few. As any location can be converted to a latitude/longitude reference point, interpretable by custom mapping solutions, the key to the data is the position from where the readings are taken. Most models rightly treat the situation as a world problem and display results on a World Map, however, the ability to focus on a specific region for a more detailed analysis of the data is equally important. Custom mapping solutions should work with several levels enabling users to garner information from a global perspective while preserving the ability to drill down into a county or region for more specific data. The type of information projected on these custom world maps can be multifold, and the system is flexible to accept new data sets as long as the information is categorized and geocoded in order to be identified on the map. At jQueryMaps, we have experience building these types of highly customized solutions, and our knowledge of how to best project different data sets is extensive.
The scientists that build complex forecast models use numerous data metrics to compute predictions around climate change. These include increases in air temperature, water temperature, the concentration of gases in the atmosphere, and water levels, to name a few. As any location can be converted to a latitude/longitude reference point, interpretable by custom mapping solutions, the key to the data is the position from where the readings are taken. Most models rightly treat the situation as a world problem and display results on a World Map, however, the ability to focus on a specific region for a more detailed analysis of the data is equally important. Custom mapping solutions should work with several levels enabling users to garner information from a global perspective while preserving the ability to drill down into a county or region for more specific data. The type of information projected on these custom world maps can be multifold, and the system is flexible to accept new data sets as long as the information is categorized and geocoded in order to be identified on the map. At jQueryMaps, we have experience building these types of highly customized solutions, and our knowledge of how to best project different data sets is extensive. 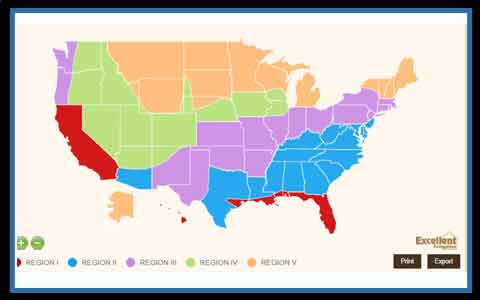 Depending on whether the data is a fixed point or a varying condition following a range of fluctuations, it may be more beneficial to either show individual icons for each collection point or group these locations on the backend to only show a heatmap with all of the variations. Projects are also not tied strictly to a single data set or fixed view. Many of the most compelling interactive maps employ a system of filters to allow users to display multiple data sets and manipulate the way the information is plotted. Through these mechanisms, users can interact with the information on a deeper level and draw new insights from the information. As most projects also benefit from a tabular list, the map, along with the accompanying lists can be easily exported for printing or insertion into presentations.
Custom Regional Maps
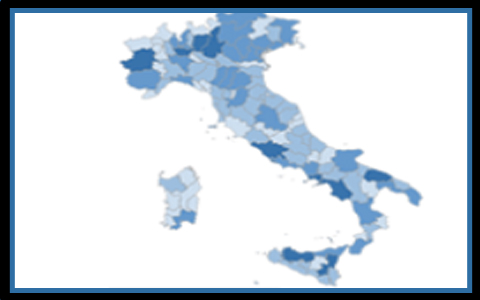 The ability to scale a project from a top-level view of the World to a specific region provides users with the benefit of perspective to see how imbalances in climate change affect the entire globe. Regions can be composed of traditional areas such as continents or alternatively custom regions can be forged by grouping together administrative divisions. For highly granular projects that fall within cities, it is also possible to integrate external sources using GIS data pulled from SHP files to produce the outlines of a scaled-in campus. Navigation then passes through these levels by assigning a parent-child ID relationship which brings users from the Global view to a custom region with only a few clicks of a mouse. If roadways are important, it is possible to show Open Street Map as a base layer or even link to Google maps within informational pop-up boxes. As all views shown in the project are georeferenced with outlines based on true coordinate values, the same data used at the World view is applicable to the regional maps.
 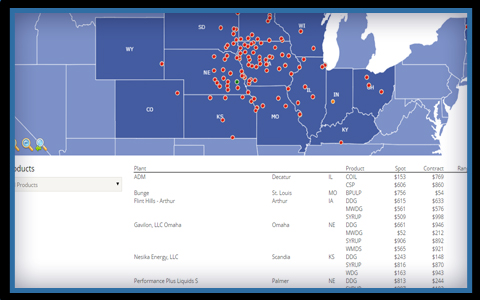 By applying the filters described above, users can manipulate the data on all levels, applying variables such as historical scroll bars, types of data collected, and whether the results should be displayed as heat maps or scattered points of individual collection sites. The final map view can always be exported as a high-resolution graphic to be shared and presented to other groups. Contact jQueryMaps for any questions on your next custom map project.
When addressing climate change, it is crucial to make sound policy decisions based on trustworthy data and employ software tools that convey the information accurately. The flexibility of these tools adapt to different data sets and assist decision-makers on how changes should be applied to mitigate damage to areas most at risk.
Share the post "Tracking Climate Change Using Custom Mapping Solutions"