When planning the next enhancement to your company website, a powerful tool to include is an interactive us map states with sub-level navigation. A static map has its limitations to filter information and provide specific content to users, however software that enables users to drill down through several levels, offers important advantages. The most common sub-divisions included with custom mapping software are zip code divisions, given their common use to assign territories, locate vendors and general familiarity to users. Discover the benefits that multi-layer maps can offer to your business and web presence.
In this article we will discuss the following topics:
-
Linking Different Types of Data on your Interactive Map database, filters, pois, pop-ups,
-
Deploying your Custom Map on your Website
-
Generating Reports and Data Analysis from your JavaScript Maps access via passwords or public print reports, pdfs, exports, links
Impacting Users with Relevant Data on your Dynamic Website Map
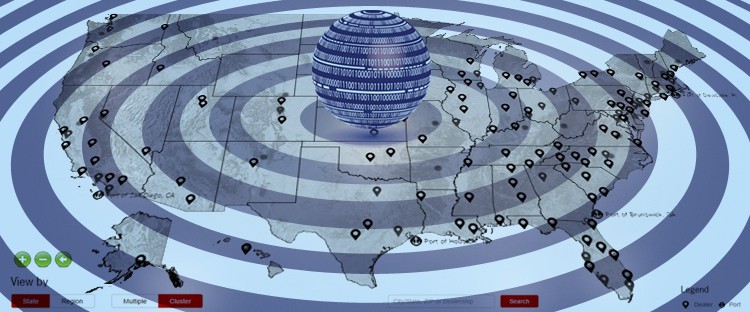
 The purpose of using interactive maps is to transmit information in a concise and well-designed manner that is easily processed by viewers. The structure of the data and the way the information is projected is almost as important as the map. Working with an experienced team can go a long way. The first consideration is to establish how much total data will be included with the map, for example, how many locations are going to be plotted or how many reps are stored in the database. Based on this amount, you can consider how to best present the information to viewers. If the map is location-based, showing icons for specific locations around the US national map, you might want to initially filter these locations to only show “top” markers at the national level. Categories may already be available in the database, assigning each location a title such as headquarters, regional office, or field office. Icons can be displayed on different levels to avoid clutter and make the map more user-friendly. See an example of this in this US National map. Another important consideration for your interactive map is how to best manage locations in close proximity to one another. If clustering is not the goal for the project, we recommend implementing a multiPOI tool that will group together all icons that fall within a pre-established radius of one another and display this group with a distinctly marked icon. When this icon is selected, a full list of the options within are displayed.
 ![]() This simple yet highly useful tool is a key to showing high-volume data on your map: see recent blog article (high-volume data). Projects with US Map States and Zip Codes, such as the following example include static labels to transmit dynamic information within reports. Basic information, such as total counts can be configured to show as labels and within a hover-over tooltip box, while more complete content is displayed only when areas are selected. Similarly, content specific to any selected area can be called within designated places in the page, such as within a results list below the map or alongside the cartography. All projects are responsive and the design can be adapted for smaller screens to avoid hindering the final user experience.
This simple yet highly useful tool is a key to showing high-volume data on your map: see recent blog article (high-volume data). Projects with US Map States and Zip Codes, such as the following example include static labels to transmit dynamic information within reports. Basic information, such as total counts can be configured to show as labels and within a hover-over tooltip box, while more complete content is displayed only when areas are selected. Similarly, content specific to any selected area can be called within designated places in the page, such as within a results list below the map or alongside the cartography. All projects are responsive and the design can be adapted for smaller screens to avoid hindering the final user experience.
Getting your JavaScript Map Off the Ground
 Good mapping solutions provide you with the flexibility to host the map, data and all code on your servers. We make the process as easy as possible. Included with the purchase of any map license, you receive full development and testing cycles for your software on our servers in the development stage of the project. We present you with a fully working model of your map that you can use to demo internally and make suggestions through two rounds of revisions. When the final project is approved, we will deliver a downloadable of all the software as a link to a zip file so that you can install the application on your servers. At this point, the map works independently and without any restrictions on your registered domain and you have the freedom to change the map within the page, website or even shift to different servers. To install your map we recommend that you check out our past articles or contact us for information.
Now that your custom US Map States with sub-levels, is running, you will need to maintain the project independently on your servers. All of the data being populated in the map is pulled from either database tables or a static XML file. For the former, you will need to access your servers via ftp to open the database and apply changes. Once the updates have been made and saved, all of the information is immediately reflected on the map. For locations, the lat/lon can be manually inserted or we can use a lookup table to extract this information. For the case of XML files, you should use your preferred editor, such as Dreamweaver or text editor to apply any changes to the file and saving them on your website server. Always make a safety copy prior to applying changes, however, you can see that the process is quite simple and automatic.
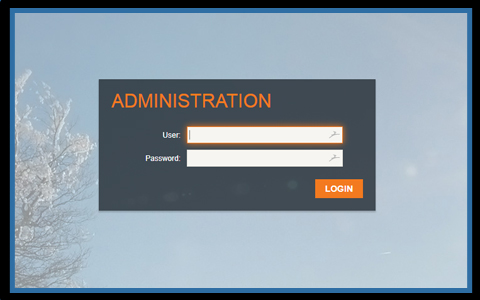
For projects that require a non-technical option for applying changes, we recommend considering a custom admin. This admin provides an intuitive and easy to use login page to access the fields that can be edited, deleted or new information added. This option is explained in greater detail and contact us to make an online appointment to view several admin tools live from our servers. This will give you a first-hand view of how simple interfaces simplify the data entry process. Finally, in the event that your website currently works with a CMS, we can set the map to read from the same database so that you can continue to use your system without any hiccups.
Making Full Use of your Custom Mapping Software
 Any mapping solution can be configured to provide multiple views of the data. This flexibility is very important to control what information is presented to viewers depending on how the accessed the map. The map can be installed behind password-protected pages, within intranet servers, or on a public-facing website. As such, not all locations need to show the same information, and we will work with you to create the necessary parameters to separate private from public data. Just keep in mind that the map always resides on your servers and is fully protected by your existing firewalls and security measures.
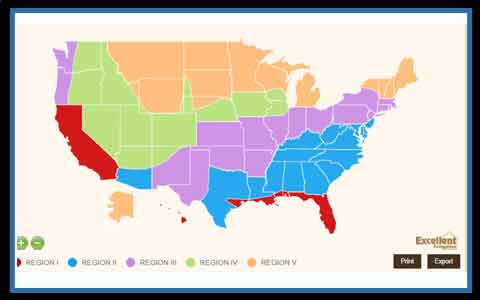
For public-facing projects, the information displayed should be useful, concise and specific to the user’s needs. If they accessed the page from a previous form, we can filter the map to show data in their region, or by a specific product, type to increase efficiency. Many projects use their public maps as a friendly and sleek tool to provide location information, contact details or general info to viewers.
The needs of the map are often more sophisticated when the system resides on an internal-facing page or company intranet. These types of maps are often used by management to analyze larger business activity and its impact on a regional level using the map as a tool to color code and populate multiple datasets of information. [Image of COKE project] Some of the features that are popular with these internal systems include results tables that can be ordered, filters and report generating tools.
Map Lists
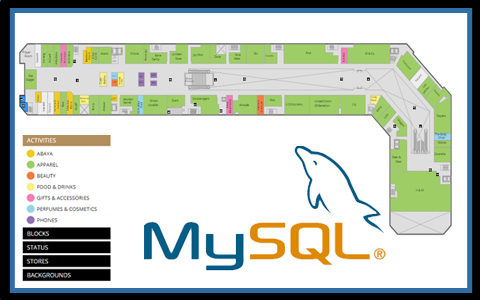
The first is a practical method of adding lists that correspond to the icons and each level visible on the map. These results tables adjust as users apply filters, navigate into specific areas or activate other tools in the project. [image of waterlab] The list points directly to the icons displayed on the map and clicking an item in the list also calls a pop-up box with specific details for said location. These lists can be ordered, numbered (linking to icon labels) and exported to highly personalized Excel or Access tables. This makes generating reports for geographic areas a simple task.
Custom Map Filters
![]() Map filters are often the crux of a mapping system, as carefully planned filters allow for users to generate complex datasets and project them on the map. Filters can include options by date range, specific product, a particular region or any other data element stored behind the map. There are numerous types of filters including single selection dropdowns, multiple item lists, ranges, toggle boxes and much more. It is even possible to use a feature in a filter to activate specific regions, color-coding them on the map, in order to analyze said areas and display specific results both on the map and in the results tables.
Map filters are often the crux of a mapping system, as carefully planned filters allow for users to generate complex datasets and project them on the map. Filters can include options by date range, specific product, a particular region or any other data element stored behind the map. There are numerous types of filters including single selection dropdowns, multiple item lists, ranges, toggle boxes and much more. It is even possible to use a feature in a filter to activate specific regions, color-coding them on the map, in order to analyze said areas and display specific results both on the map and in the results tables.
Custom Map Reports
We have discussed the options of creating custom reports at length in a previous articles. Simple reports include exported lists that can be formatted with specific fields activated and highlighted or print layouts that include either the map or the map and results table combined. For most advanced projects that require a specific layout, such as brochures or pamphlets generating tools, we can export the content of the map, the data and all legends to a dynamic HTML page which is formatted according to a pre-established design. Once the content is loaded into the page, the entire layout can then be saved as a pdf file for use within custom reports. Keep in mind that any of the exported content, including high-resolution map image exports, can be easily included in PowerPoint presentations or sent via email.
For maps that require US National views with States and sub-levels, there are many options to consider with the project. We always recommend a quick conversation with our team to better understand the solutions we offer and a free commitment-free quote on your project. Contact us at your convenience and we hope to be of assistance.
Share the post "US Map States and Zip Codes for Superior Websites and Apps"