As mobile devices and tablets become ever more prominent for users accessing information on the internet, JavaScript interactive maps have become the standard in the mapping industry. Well designed JavaScript Interactive Maps offer users a responsive tool for transmitting information instantly to users. There are many ways web-based maps can be used and at jQueryMaps we have had the honor to work with companies across almost all major industries, ranging from small startups to Fortune 500 Corporations.
Applications:
While listing all of the applications in which our JavaScript Interactive Maps have been used is impossible, we would like to take a moment to discuss some of the major tendencies in interactive online mapping. Since all of the software we provide is built from scratch, any aspect of the map and interactivity with the data can be customized to meet your exact needs.
Real-Estate:
 Perhaps the most traditional use for JavaScript Interactive maps across the web is in the real-estate sector. The basic purpose is to display properties which have been recently sold or are currently for sale along with basic information for each listing. This functionality can be expanded considerably with the inclusion of sophisticated filters to search by a specific criteria within select areas. We have created tools that include admin systems to also define neighborhoods and school zones and automatically display listings that only fall within these areas. Since these boundaries are constantly changing, the ability to redefine the lines is imperative to a successful project. See live examples of how JavaScript Interactive Maps have been used for the Real-Estate sector.
Business Sales Monitoring :
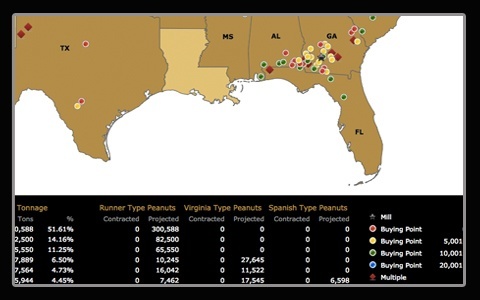 It is common for companies to use tabular reports to monitor sales activity, however there are numerous benefits to using JavaScript Interactive Maps as opposed to a just sheets of information. The same views offered with tabular data can be integrated with any map project through results tables listed below the map. The additional benefits of adding geographic location data is immeasurable for visual and analytical purposes. See more details in our previous published article.
Statistic Maps / Heat Maps:
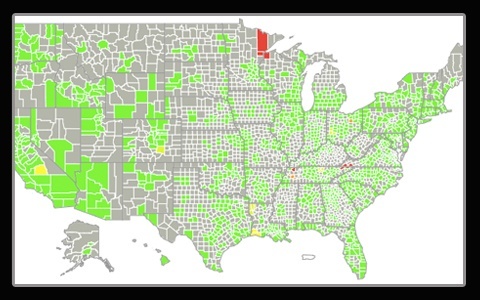 Many projects work with big data and JavaScript Interactive Maps serve as a platform through which to interact and interpret the information. An important project that jQueryMaps created was a custom map for the New York Federal Reserve to display mortgage rates throughout the US and color code tendencies by regions. The project worked with a system of filters to easily select a year, region and product to view the results of the search projected on the map. If you work with any area-based data, such as statistics by Country, States, Counties, Zip Codes or Census Tracts (just to name a few), your project would integrate seamlessly with our JavaScript mapping solutions. Heat Map example 1 and example 2.
Company Portals and Admin Tools:
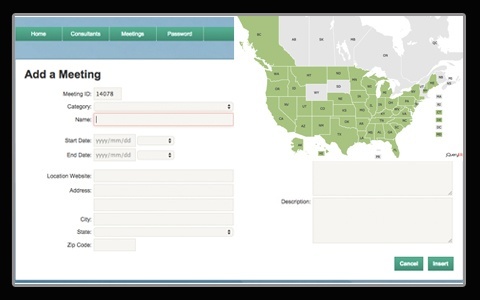 Not only can JavaScript Interactive Maps be used to display information, but it can also interact and save selections through a custom portal. Our work with many major companies, often include an Admin tool that accompanies the project and allows users to make selections through the map and save the results to a database. Such portals can be simple click through maps or much more advanced systems. In many instances the results of a user click on the map and interaction with list filters require the information to be stored for later use. For example, maps are often used by clients and sales reps to enter and update sales territory information. By selecting sub-divisions, reps can define and store their territories, along with any other associated information such as pricing by area or past sales leads. These types of portals are quite useful as they often share some of the responsibility for data management between users and the end client.
Locator Maps:
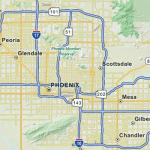
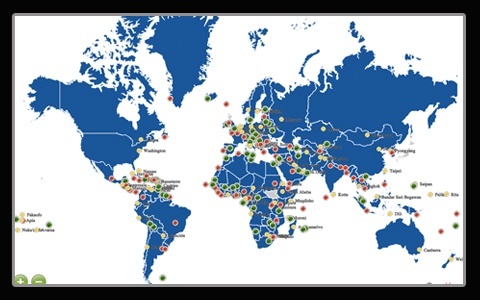 Using JavaScript Interactive Maps for developing projects to show points of information on a map is a common application of our products and can offer many powerful options. Locations can be shown on any level, whether at a global view or within a specific administrative division. This categorization by level can be setup to work automatically. For example, if a project has many locations, say offices and partnerships around the world, perhaps only the central offices are shown at the global level, while the partnership locations are populated at the lower levels. New enhancements to the project, also now better support high-volume data maps (see discussion) to display on all levels or selectively called through a system of filters. Locations can also be combined with OpenStreetMap for seamless navigation down to street view within the same application. See live examples our Showcase page.
Trade routes:
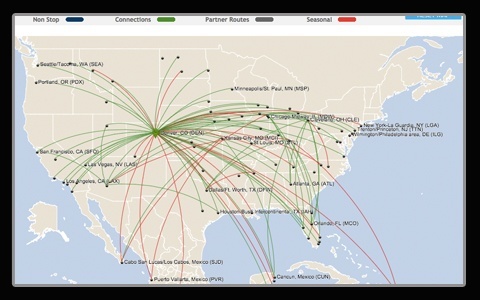 The ability to show connecting lines between any two points, easily lends itself to using JavaScript Interactive Maps as a tool to oversee trade routes and supply chains for any manufacturing company. The routes can be direct from a specific location to several destinations, such as is often the case with airplane navigation from a hub to multiple destinations. See example We have also built more complex solutions that include supply chains with several layers of distributors. In this scenario, a manufacturer view the complex supply chain between distributors for any part used in their manufacturing process. Each step of the chain would include a connecting line and details about the distance and type of transportation used. This is very useful for troubleshooting and minimizing the impact of natural disasters and political unrest on production, as routes can be filtered and analyzed individually through all the chain of suppliers.
Interior Mapping / Floor plans:
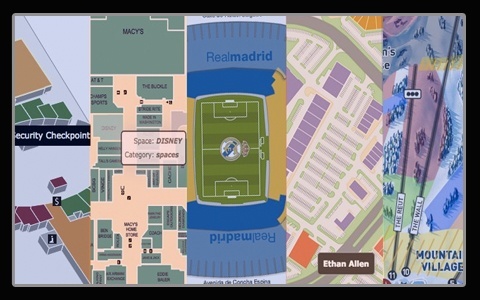 JavaScript Interactive Maps through our DynamicLocator product provide an impressive and useful solution for mapping the layout of any building or venue. This is perhaps the fastest growing product at jQueryMaps and the opportunities for implementing this tool are endless and apply to any industry. We have used this tool to create hospital maps, stadium maps, development area maps, warehouse maps, office building maps and much more. In addition, the same tool can be applied to exterior areas to produce tools for mapping golf courses, ski mountains or any other custom space. See live example from our Showcase page.
These examples provide just some of the situations in which JavaScript Interactive Maps have been successfully implemented for companies across a number of different industries. As all of our mapping solutions are fully customizable, we can provide any special features with your project to meet your particular requirements. Please contact us for more information or to request a free 30 minute commitment-free consultation. We look forward to getting your next mapping project off the ground.