When analyzing supply chains and distribution networks for global manufacturing companies, reliability, efficiency and cost are paramount considerations. There are numerous parameters by which this information is calculated and certainly each company is specific in its needs and unique relationships with suppliers. jQueryMaps has had the opportunity to work on several custom solutions for large manufacturing companies where the jQuery World Map was an integral part of the supply chain analysis process.
Overview of Supply Chains with jQuery World Maps
 In the discussion below we will look at a few of the key factors that make up a successful supply chain map and how jQuery mapping tools can be used to improve the effectiveness of monitoring and improving connections. All projects are highly customized and can be adapted to any Company requirement or industry standard.
Data Parameters to Analyze a Supply Chain
There can be innumerable parameters used to determine the reliability and effectiveness of a manufacturing supply chain and in this article we will take a look at some of these options. jQuery World Maps support multiple data sets and filters can be applied to load specific information and show multiple options within the same view.
Supplier Reliability
 When looking at reliability as a factor within a supply chain it is important to consider both the individual supplier and the region in which the components are being shipped from. Individual suppliers have an important track record that can be brought into the equation to assign a numeric value and category to the company. These values can be arbitrarily assigned or based on empiric data that calculates the volume of business conducted with the parent company, delays, possible issues encountered along with other factors. Using this information, normally stored in a database, the system can calculate a point range to each supplier and automatically assign an icon based on this value. This provides a quick and informative glimpse of all suppliers and an easy way to distinguish them based on their overall calculated reliability.
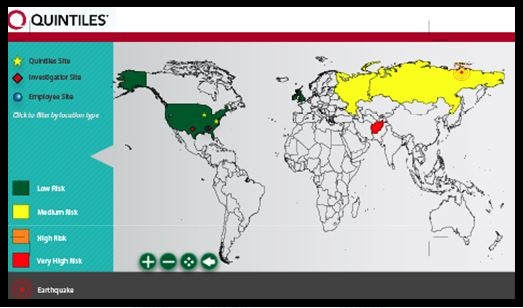
As part of this equation it is probably important to also consider the volatility of the region in which the supplier is conducting their business, accounting for geopolitical stability, climate factors and likelihood of interruption in production. These components weigh heavily in determining the level of supplier reliability and can be included in the point calculation or separated to assign a color to the country in which they are conducting work. The end result of this process, is a dynamic jQuery World Map that assigns icons and colors to Countries based on their calculated reliability and further allows for management to filter for specific ranges.
UpStream Factors
 One benefit of our jQuery supply chain maps is that we can filter and show both upstream and downstream suppliers. For example, the end client may want to analyze not only their chain of suppliers, but also the sub-suppliers which also contribute to the manufacturing of their products. This features allows for the jQuery World Map to be seen from the perspective of any sub-supplier who receives products from a chain of suppliers and also ships products to the end client. In specific cases, jQueryMaps has produced a personalized admin tool that the end client can send to their suppliers to fill in the data. The information is specific to each level of access and only a select segment is visible to the sub-supplier. This provides an efficient way to gather information for both suppliers and sub-suppliers and include these within the mapping tool.
Efficiency
Certainly efficiency for receiving and processing new orders is an important consideration. The efficiency can include calculations on lead time for production, backorder status, type of transportation used and distance. All of these variables can be tallied into a calculation in order to assign a grade of efficiency for a specific product coming from a particular supplier. The type of transportation used on the jQuery World Map can be displayed as a moving icon (boat, plane, train or truck) that follows the curved paths connecting end clients, suppliers and sub-suppliers.
Carbon Footprint
Based on a combination of factors, it would be easy to calculate and determine the overall carbon footprint for manufacturing and shipping specific products across an array of suppliers. This information is a big step in promoting reduced emissions and bolstering an eco-friendly company image.
Cost
Cost of production is a constantly shifting factor that is based on many components, including the cost of energy in manufacturing, cost of transportation, margins and market influences. Any of these variables can be pulled from a backend database to include an approximate cost ratio for each product and supplier. As the information in the back-end database changes, say a shift in currency or increase in oil prices, the calculations and results of the map will update automatically. This means that a field change in the database reflecting a jump in the cost of shipping could automatically place a supplier in a different category and depict their location and connecting line in a different color (say orange instead of green).
Features of the jQuery World Map Supply Chain
 We will look at some of the features that were integrated with past projects, however this is not a limit of what can be developed with our maps. Let us know if you have any ideas or requirements for your supply chain.
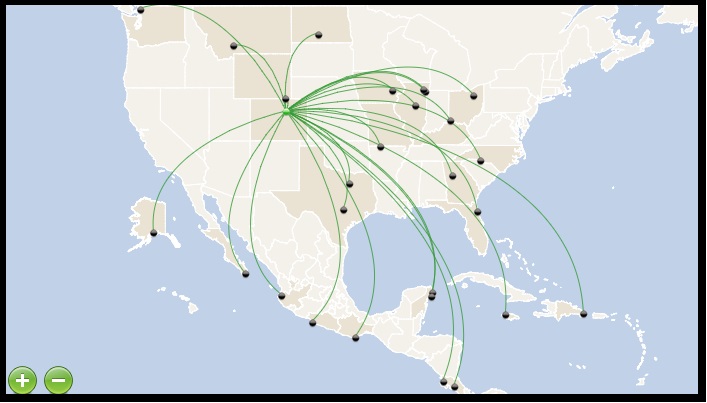
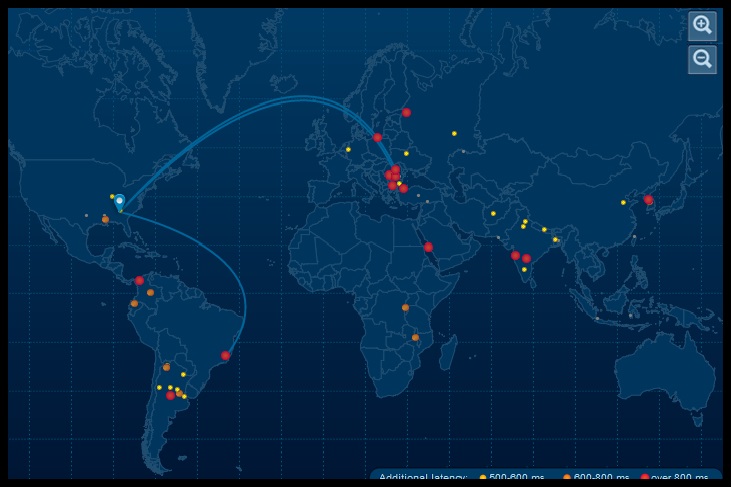
- Arched connecting lines: See an example of how our jQuery World Map supports arched lines connecting the end client, suppliers and sub-suppliers in a highly visual and intuitive tool. The color of the lines can be assigned based on database values and ranges. For example, efficient chains could be shown in green, while less efficient routes in yellow or orange.
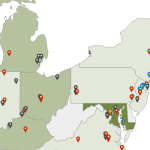
- Dynamic icons: All icons displayed within the map can be assigned based on database values. Therefore it will be simple to easily view differences between suppliers by the color of the icons assigned and/or the size of the icon. For example, the size of the icon and color can be variable factors reflecting the volume of business conducted and the reliability of the supplier. See example of a US map with varying size icons.
- Filters: A powerful tool behind any map is the ability to easily change between datasets and set parameters by which to view the results on the map. See example. Management may want to analyze the supply chain for a certain product within a specified time range in order to determine which suppliers were most efficient in providing the material to the manufacturing line. Common filters used in our maps are data ranges, drop down filters, list filters, toggle filters and custom options that support multiple criteria (product and price)
- Presentations: The visual nature of our maps lend themselves to capturing user attention and quickly transmitting information. The maps are hosted completely on the end-client server and can be visualized through different levels of access. For example, we can limit the amount of information available for specific users as a way of easily sharing the tool within management of the company and eliminating concern over revealing confidential information. All of the world maps can also be exported as a high-resolution image to be used within PowerPoint presentations.
- Admin tools: In order to share the tool and encourage supplier and sub-supplier participation jQueryMaps has built a simple admin tool with varying levels of access. This enables a supplier to share the map tool with all sub-suppliers while still concealing all of the upstream customers in the supply chain. This layering of accessibility enables the quick sharing of the tool to simplify the data entry process for all of the materials that play into the manufacturing of a final product.
Summary
We have all followed news reports and seen first hand at our local stores the effects that extreme weather, global unrest and oil prices have on the availability of certain products. For global manufacturing companies, limiting supply chain exposure to these disruptive forces is vital for preserving a sound and reliable supply network. jQueryMaps has generated custom solutions for several large Companies seeking a visual tool to better analyze, manage and report on the different levels of a global supply chain. Such a tool is highly personalized for each industry and offers excellent tools to examine any network by product type, region, type of transportation or other variable. A system of color coding via data ranges, assigns colors to the distribution lines and countries of origin to quickly depict the status of any network chain. The end result is an intuitive jQuery World Map that is directly linked to internal data in order to be used by management and internal personnel to analyze a supply chain and produce highly visual reports.
For more information and details, please contact jQueryMaps directly.
Share the post "jQuery World Maps Applied to Improving Global Supply Chains"