
In the custom solutions offered by jQueryMaps, the map interface offers an intuitive method of displaying complex data structures. We are all familiar with maps as ubiquitous navigation tools, guiding us through our daily tasks and avoiding undesired surprises along our commutes. However, well-crafted map software, powered by location data offers a powerful insight that can be used by company administration and policymakers to advance meaningful agendas and grounds on which to base important decisions. The map software is often the final window through which location data is analyzed to better understand any number of activities that surround our daily lives.
In this article we will look at the following topics:
-
Collecting Information for Creating a Custom Map
-
How Data Should be Displayed and Organized for your Project
-
Customization of your Map Software
Powerful Data behind your Map Project
 The data behind any map software is key to the end-result and ultimate goal of the project. A basic project may include data to identify locations on multi-level maps, such as chains shown at the city level and individual retail locations plotted within a city. Other types of projects focus on live data, such as tracking a fleet of vehicles during a business week or managing a supply chain in real-time. There is also a lot of focus given to analyzing data linked to smart devices to review movements and spending habits over a period of time or within a particular building complex. According to each scenario, the setup of the project would differ to maximize the amount of information conveyed to the user of the map software. In some cases, the end-user is a visitor of a kiosk and all information is open to the public, although in most situations most of the details are reserved for only administrative users. This dual faceted approach to a single map provides a powerful tool that does not need to be duplicated. The same map application can provide useful lookup tools for some users, which reserving the more complex data to only secure internal viewers. When creating your project it is important to outline your immediate needs based on the presently available data for the project. At the same time, it is beneficial to keep in focus other eventual goals for the project, which can be incorporated into the map software once the project reaches a certain scale or when additional data becomes available. Any number of data layers can be overlaid on a project and either blended with existing tables or called individually through specific filters.
Using Custom Filters with a Map Project
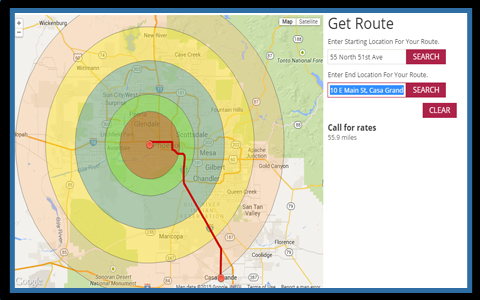
 Data for a project can be as varied as the cartography shown on a map. When looking specifically at interior mapping applications, the basic confines of the map would be the edge of the building which separates the property from adjacent areas. In this scenario, almost all buildings are unique in their layout, positioning, and scale. The cartography carefully shows the rooms within the building including any commercial spaces, such as coffee shops and retail stores. The data for a project can be equally varied. For many interior maps, the leading goal is to provide an easy navigation tool for visitors to locate a specific department or room within the building. This is easily achieved by showing users their current location on the map and providing a clear search feature to filter by name, type of room or location. The result would highlight the recommended navigation between the two points. Data, however, can be expanded well beyond navigation purposes. In some cases, building managers need to make critical decisions on where to insert new commercial locations and how this can impact foot traffic within a facility. By using reliable location tracking software and displaying this information on a dynamic map with historical replay features, patterns start to emerge that would otherwise be difficult to detect. A heat-map showing movement within a building has compelling uses. This type of project can be coupled with sophisticated filters to extract sub-categories of information and project these visually over a historic period of time. For example, it might be helpful to see only users that entered a coffee shop during a specific time period to gather patterns of behavior. This insight can help buildings grow to become more efficient and better adapted to their clients.
Creating your Industry Specific project
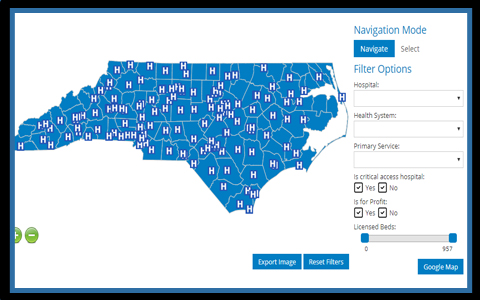
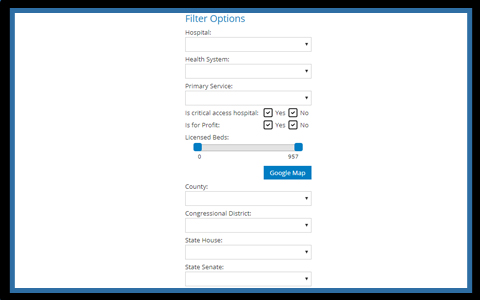
 Our years working with clients throughout multiple industries have granted us the perspective to understand that while no two industries or companies are alike, there usually are common tendencies between mapping requirements. The first step to customizing your project would be to identify the area to be mapped and the available data. Based on how the information is organized, whether by city, retail location or specific lat/lon values, different layers of cartography can be used. It is an exercise to minimize the necessary actions a user must take on the map software in order to obtain desired information. Additional layers can be added as information becomes available that warrant additional clicks on the map. For example, if a project is identifying single locations within a State, showing city icons would be a streamlined and logical first step. If later on, further information is added, such as interior mapping for each location, then additional layers can be added to the project. To the extent possible, we usually recommend consolidating data at the top-levels and showing individual entries as a user navigates further on the map. Combining information into multi-POIs is a simple method to grant extensive information to users while minimizing clutter on any view. Multi-POIs gather multiple entries within a single marker that can be expanded as a pop-up or spiral icon once selected. These types of icons can be inserted into all types of maps and on any level. Another approach to maximizing the efficiency of your map software is to integrate a system of filters to work in conjunction with the map. The filters can be tailored to your needs with default values and categories that can be called individually or in overlapping layers. Each option has its own benefits and serves different mapping goals.
When organizing the data for your map software, we recommend that you subscribe to a free 30-minute consultation to speak to our team of experts. We can help guide you through the steps of organizing your next project based on your current requirements while keeping an eye on potential future goals.
Share the post "Discover New Approaches to Using Data-Driven Map Software"