It is interesting to think that even today, we continue with the tradition set by our nation’s agricultural past for scheduling elections during the late fall. This was seen as an important time, once the harvest was complete and before the cold of winter settled in. With the turn of the seasons, we all may think of falling leaves, hot cider and football, but elections should also be included in the list. While national elections gather much attention, off-year and regional elections are often overlooked. At jQueryMaps we have had the privilege to create great HTML5Maps for several election monitoring projects such as the 2012 national election coverage with CBS News.
Following election results in real-time has become a necessity for any monitoring service. The dynamic and interactive design of our maps, lends itself to interacting with complex data. Our system reads election information from any external XML file or JSON data, which can easily be included as part of a RSS feed, data feed or database query.
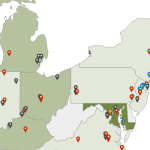
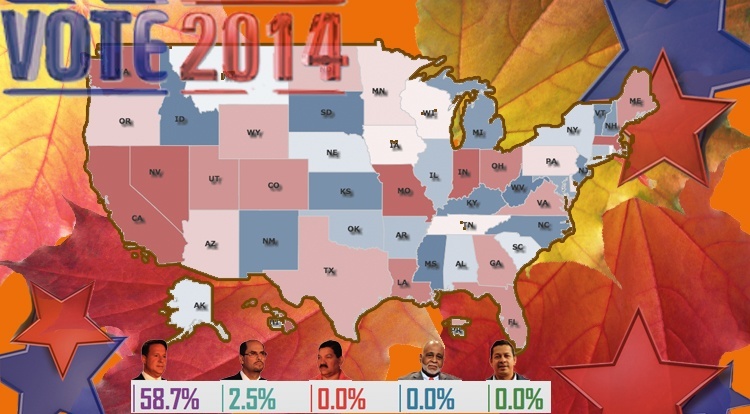
The benefit of working with dynamic data is that the maps will update in real-time as new information is received. This can include the color coding of areas (State, Congressional Districts, Census tracts) based on the latest results, the refreshing of counts and percentage labels, updating charts and any other dynamic elements.
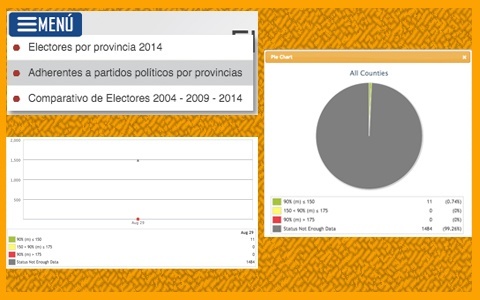
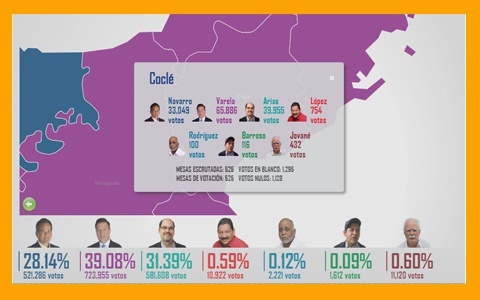 In the case of the recent national elections in Panama, created for MedCom / TeleMetro.com, one of the challenges was to handle multiple race results on a single map. By including a system of parameters and user filters, the end project combined national and municipal election results within the same project. Any number of filters can be added to a project and dynamic content such as charts and percentage scales greatly improve the visibility of the information.
 We encourage you to contact us to see more examples of election maps that we have created in the past, and write us if you have any specific tools that you would like to see included.
See how jQueryMaps can bolster your next fall election monitoring project!
Share the post "Using jQueryMaps to Show Real-Time Election Monitoring Data"