There are many situations in which online mapping tools can improve the overall user experience of a website. Over the years at jQueryMaps we have been contacted by businesses of all sizes covering most major industries, and yet every project is unique in its requirements and final deployment. We wanted to provide readers with a quick summary of some of the cases where our maps became central to producing a great solution for a web application.
ABM – Human Resources and Employee Distribution Map

ABM is a large building maintenance and facility services company that is listed on the NY Stock Exchange. Within the Human Resources department of the company, there was an initiative to pursue a mapping tool as a way of organizing employee distribution across a number of States. The goal was to offer a tool to determine how far employees needed to commute and which employees lived in the same areas as part of a centralized system that organized the department’s data. The requirements of the tool were to offer a filter option to display results based on different types of employees, loading the map with the specific color schema according to each selection. Once created, the map far exceeded the expectations of the initial project scope. The system included a list to the right of the map and a personalized results table that listed the tally of total employees for each category selected. One of the key elements of the project, is the integration of dynamic labels to the map that display on the center of each County with data. These figures are pulled from the system’s database and are displayed in the system’s export to PNG tool. This enables project administrators to produce high-quality images from dynamic data that can be easily integrated with any report, portfolio or PowerPoint presentation. See prototype of the map created for their Web Application.
Gametime Lacrosse – Sports Engine Map with Results Table and Admin

We had the privilege of working with Gametime Lacrosse since the inception of their business proposal. The goal was to capture the enthusiasm behind the fast growing sport of lacrosse and offer a centralized tool to combine information about camps, tournaments, programs and clinics for parents and organizations alike. The map became the cornerstone of the website, offering a highly visual tool with custom features such as an accordion (three tier) results table, filters and tabs by category. The map is the front-facing part of the project, but perhaps the most impressive aspect of the project is the engine that runs behind the map. jQueryMaps engineers worked extensively to create a multilevel Admin tool with two purposes. The first is an entry form so that new programs can easily submit information for approval and publishing on the map. As part of the entry form, programs select a username and password that later serve to access the main admin in which they can modify any of their program’s information along with options to assign images, pdf documents, and program descriptions to post to the map’s results table. The second purpose of the Admin tool is a personlized CMS that allows the website administrators to view and manage all existing programs, potential programs and directly link with PayPal for processing of subscription payments. Eventually this model has potential to expand to other sports in the US. See live map created for their Web Application
Fly Frontier Airlines – Travel Map with Route Lines and Custom Animation

When originally approached by FlyFrontierAirlines, the request for creating a mapping tool seemed fairly straightforward. The idea was to build a map for the company website that displays the airline’s routes and destinations out of their hub in Denver, CO As part of the scope of enhancing the website, it was important to stay away for generic maps on the market and preserve the ability to color code areas and customize all aspects of the project. We worked closely with the client to fully understand the requirements of the project and generated a prototype that was eventually developed further by technicians on the client’s end. The final product included options to display all routes from any of the Company’s airport locations, in the US and Caribbean, with the added feature of displaying an animated icon along the curved lines showing the direction in which the flights are structured. The flexibility the system offers allows for the product to match the exact design needs of the website and expand as new routes are added in the future. See prototype of the map created for their Web Application
MedCom / TeleMetro – Using Custom Map for Real-Time Election Coverage

MedCom first partnered with Flashmaps Geospatial in 2008 to produce an election map that at the time was created in Flash technology. The goal was to provide users with a browser friendly tool that provided real-time information on the presidential elections in Panama. The map made use of a great design, integration of live images and several RSS feeds that updated the map every 30 seconds with the latest statistics. See map originally built in Flash.
At the time the map was a huge success and hundreds of thousands of viewers used the tool to follow the close election results. For this reason, jQueryMaps was contacted again in 2014 to produce a new map for the presidential elections, however this time with a few more enhancements. The most important aspects was to create the map in HTML5 technology so that viewers could access the map from all mobile devices. Furthermore, the page in which the map was imbedded was responsive and the map div needed to resize dynamically to accomodate different browser sizes across all different devices and tablets. The content was also modified, to add data feeds for regional elections by municipalities with a separate header with overview statistics that would be populated from the same feed, yet reside in the home page of the website. The close technical and system support that jQueryMaps provided throughout all stages of the project was crucial to the successful launch of the election map tool on a short timeline. See live map created for their Web Application
sPower – Improving and Alternative Mapping Solution with jQueryMaps

sPower is a key player in the rapidly expanding solar power market. The company’s existing website offered a basic map that served to displayed locations and data for solar projects across the US. However, as business expanded, the density of the data in certain regions of the country caused overlaps that couldn’t be resolved by the existing map solution. We were contacted by the sPower to create an enhanced version of the map that would address important shortfalls. The first goal was to based the development on the website’s existing design to make the transition between maps seamless. Using the geospatial referencing ability of the map, we were able to plot the solar sites by assigning lat/lon values to each location based on zip codes instead of using city name references, thereby separating many of the locations on the map. For sites that still shared the same zip code, jQueryMaps created a multiPOI pop-up that listed all of the locations in alphabetical order to the right of the pop-up with a brief overview of all of the content. Any location could then be selected for a detailed look at the information available in a pop-up with links to extenal pages and reports. The map was produced on an expedited schedule and delivered to the client within 3-5 business days. After a quick round of updates the final product was ready for launch in the website. See prototype created for their Web Application
Guerrilla Economics – Economic Analysis

jQueryMaps has had a two year partnership with Guerrilla Economics supporting them with mapping solutions to accompany the private economic studies that they provide to their clients. Guerrilla Economics offers a great service, providing highly detailed economic studies on factors that are impacting any number of industries, including political changes and the forecasting the effects of new laws. The study is published in a detailed pdf document and make accessible to subscribers. jQueryMaps was contacted to work on several independent projects for Guerrilla Economics, however as the volume of work increased it was thought that a mutually beneficial partnership would be the best way to move forward. jQueryMaps provides automatic updates and support with any project, including solutions that make use of Congressional District, Upper House and Lower House divisions. The partnership works seamlessly and has provided the addition of mapping tools to enhance the impact of future economic studies. We await the launch of our next study!
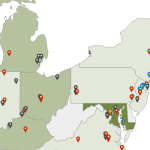
Cleveland Federal Reserve – Internal analysis map
 jQueryMaps has had the honor to work with several different branches of the US Federal Reserve in the past, including producing custom zip code maps for the New York Federal Reserve in the past. When contacted by the St. Louis Federal Reserve, one of the initial requirements was for the map to accessible on all mobile devices, which is a hallmark feature of our HTML5 Mapping Solutions. We worked with the technicians to produce a prototype that addressed the requirements of the project. The map need to have two cartography sets. The first would show USA States in the initial view with options to drill down to a State and select any County within. The second alternative cartography displayed Counties in the initial view with the possibility to produce a heat-map effect to easily spot trends at the national level. Once the final version of the map was approved, the technicians on the client’s end installed the map on the intranet within an hour and were able to seamlessly connect the map to the reserve’s internal system. See prototype created for their Web Application
Bodicare Cosmetics – Defining Exclusivity Boundaries and Prospective Client Lookup

The company was in the early stages of launching a major sales initiative and was in search of a tool that would allow them to organize territories for agents across the US as well as provide statistical feedback to managers. The first purpose of the tool was plot existing clients with prospective clients on a map with distinct icons. Since the business model was to offer exclusivity to saloons that carried their product, the second major goal of the map was to offer a quick lookup tool to see whether new prospective clients would breach the 5 mile exclusivity boundary. Through a zip code search lookup, we created a search that would display a radius overlay on the map, centered on the zip code and mark the prospective location with an X if in violation of another saloon’s territory, or with a green check icon if approachable. This easy lookup tool, provided an excellent resource for agents in the field. Another addition to the map was an Admin tool, that enabled management to updated content to the map, assign new saloons and add agents to their sales force. See prototype created for their Web Application
Octagon – Comparative Sales Analysis with Custom Tool

The requirements of this second example were highly specific and the internal tool required extensive customization to create. The initial goal was to provide the end-client with a system by which to compare locations and statistics for two competing beverage providers in two different sport sectors. The industry works with custom territories and the first task was to implement these divisions by groupings of zip codes into the cartography. The final map had three layers of navigation, all working with custom industry specific divisions. The second component was to implement a sophisticated system of filters to better contrast the type of information being displayed. For example the ability to compare sales of a beverage a specific stadium for football vs baseball. The largest component to the project involved creating an admin accessible from the main page to 1) select and compare the statistics of any number of locations 2) modify and assign an icon size to any location 3) Drag/drop icons on the map The final tool, offered a powerful system to view and compare sales statistics in the beverage industry, across various sports and for numerous venues across the country.
Landsman Appraisers – Drawing overlays on Street Detail

We were contacted by a small business owner who had created a website with important company information and contact details. The client was interested in taking the website to the next level to organize appraisal territories for a metro area in Nevada. Since the appraisal territories would be used internally to assign prices, list locations and offer pictures for specific locations, the importance of using a map was fundamental to the project. The challenge for the client was to find a solution that offered flexibility to create territories and later change them internally as the lines needed to be redrawn. At jQueryMaps we worked closely with the client and presented an Admin tool created with OSM to generate overlays on the map. Using anchor points, the user could easily create polygons over the street view of his/her area, and save the information to a database with descriptions, images and icons. The ability to manage the territories in-house was fundamental to this project and the tool became integral to the website. See prototype created for their Web Application – Page & Admin
Share the post "10 Cases when Using a Map was a Great Solution for a Project"