Transmitting information in a concise, well-organized and intelligible fashion is important to any company and industry. Whether as a requirement for weekly sales, quarterly profits or annual profit/loss balance, reports provide fundamental insights to our day-to-day business. Facilitating the ability to generate business reports and enhancing their appearance is fundamental to most data-based software. With this idea in mind, we are presenting a list of the different options available and the implementations that have worked successfully for our clients.
Options Available
There can be many different styles and complexities to the type of business reports a Company would need to produce, however in almost all cases the information that needs to be filtered and presented is pulled from a back-end database. When working with maps, the map interface is in and of itself a filter mechanism. The information displayed at any view is filtered by the area selected. For example sales locations are plotted and listed on the map by the level selected. Below we are providing some of the common features required by business report generating software.
Printing Maps and Results Tables
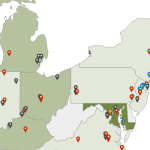
 All business reports need to be printed or exported as images. Integrated buttons can simplify this task, directly calling an installed printer or pdf printer. Our maps offer the option to print any view including the results listed below the map. This tool is helpful for projects that include lists that accompany the data displayed on the cartography. For example major cities where sales occurred in the last 6 months can be plotted on the map, while a breakdown of individual sales grouped by sales within each city can be listed below. Printed reports provide a tabular view of a specific cross-section of information and can be enhanced by images, graphs or other dynamic components. In most cases, including with our maps, the tables can be filtered by category, changed in order or organized by date. Contact us to see an example of a map that includes results tables as part of a business reporting tool.
Export to Excel
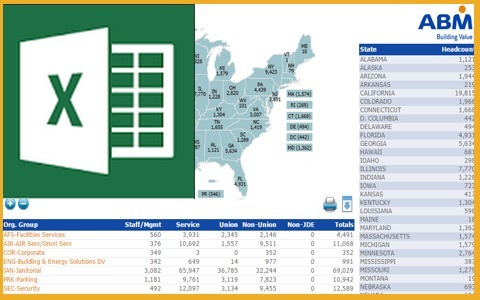 Whether as a means of applying separate calculations to existing data or to consolidate reports from several different sectors, being able to export content to Excel can be very useful. Excel is probably the most common software used by administrators to read and interpret business data. Being able to generate business reports in Excel and customize the type of information included in each report is highly valuable. With our maps, any data can be exported to Excel and filters outside of the map can also work in conjunction with the process. A user could select a specific data set, say sales by a particular rep or within a specific date range, and these parameters would then be received when the export button is pressed. Quickly being able to generate Excel exports is both a practical and powerful method to transmit content to members of your company.
Other tools: filters, charts and graphs
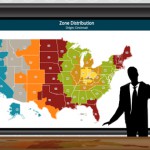
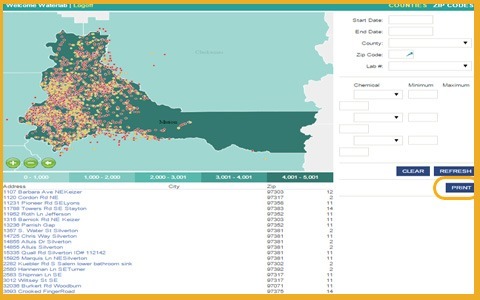
When exporting data to generate business reports, flexibility to filter the information by specific criteria is highly important. This enables administrators to analyze specific data sets and draw accurate conclusions on business activity. When using a map, the level of navigation is the first filter. When a user clicks on a State, the information is filtered for only data corresponding to the given State. Secondary filters are also important to provide advanced filters. These are common in most project and a key element of the services we provide. Filters can include options by data range, product category, sales rep or by any other custom reference. See an example included with the following US States project.
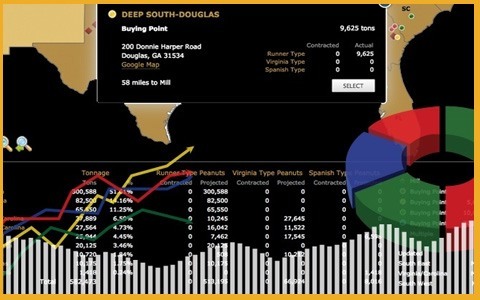
 Many projects also benefit from other visual tools such as charts and graphs. These tools can be easily inserted in a map pop-up box for any area (pie chart of sales for a State or chart of sales rep activity in a County). The tool used to generate the charts and graphs is dynamic and also pulls information from the database and is capable of reflecting criteria defined in the filters. The images can be extracted, both manually or automatically, to display within the printed report or as images within the Excel export. Being able to define specific data sets through filters and offer a map view alongside charts and graphs, is a fantastic solution for any company interested in clearly presenting their business data through custom reports.
Using Dynamic HTML Pages for Business Reports
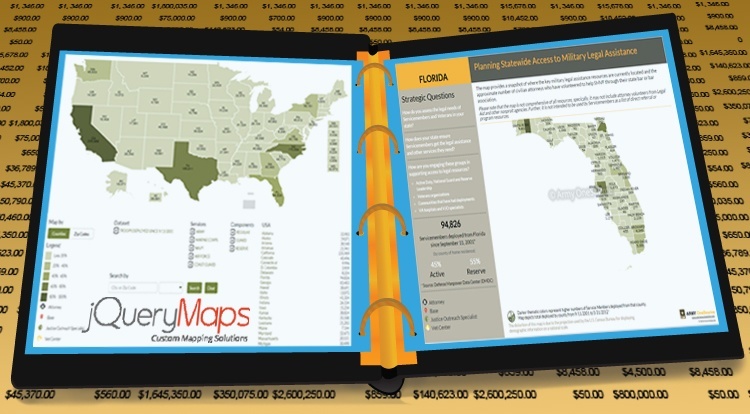
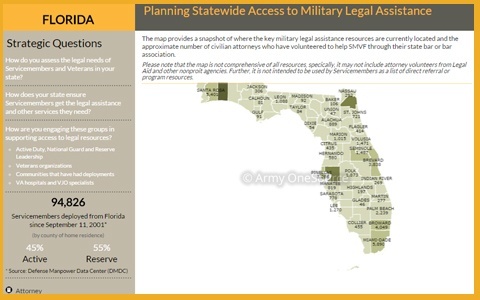 Extracting high-resolution images for business reports is just the start of the possibilities, as seen in the following live example. We have worked with two clients recently that needed to generate highly-personalized reports for end customers on a per State and per County basis. The reports needed to be full pdf pages that contained custom content, specific values, in addition to map graphics. Our solution for this request was to create a dynamic HTML page that received information dynamically from the project database, responding to any filters applied within the map. Therefore viewers would use the map to select the type of data they needed to show within a specified date range. After setting the filters and clicking on a State, a button was activated to PRINT PDF report. This function would then pass the map selection values to the dynamic HTML page to populate with information from the database. This includes the area name, the specific statistics for the area and a PNG graphic file of the selected area. This PNG file can also be rotated to show vertically or horizontally depending on the optimal dimensions. The final step in the automatic process is to save the same dynamic HTML page as a pdf file that can be instantly downloaded, saved and shared via email, inserted within a business report or presentation.
This tool opens the possibility for companies to automate the report generating process and create aesthetically attractive reports that include company letterhead, graphics and logos, along with dynamic data and a high-resolution export of our jQueryMaps cartography. Users can generate these reports when needed or the process can be scheduled to run automatically and have an alert sent via email. For example, the process can be configured to produce highly customized reports on the first of the month or at the end of the quarter. See a live example of a business report solution created for end client Army OneSource.
Benefits of Powerful Reports
 Reports and accurately transmitting sales information within any company is fundamental to formulating future strategies. jQueryMaps offers several tools that are easy to use and extremely useful to any business administrator. Our maps are designed to work with filters to define specific data sets and display these results instantly on the map. These results can be displayed as icons, lists below the map and included in reports through high-resolution JPEG export or page print. The resulting images can then be used within slide presentations, PowerPoint documents or shared via email. For calculating purposes, maps can be used to filter the data sets and then an export to Excel can be used to produce specific data within Excel. These can then be used internally in any number of ways. Lastly, for highly custom reports that include company letterhead and dynamic data outside of the map, we can create dynamic HTML pages that receive the map graphics, display information based on the filters applied and save the entire page as a pdf file. For any of these, the process can be run manually or configured to be produced automatically according to your company schedule.
Consider jQueryMaps when creating your next company report. Please contact us with any questions on this discussion.
Share the post "Using jQuery Maps to Generate Better Business Reports"