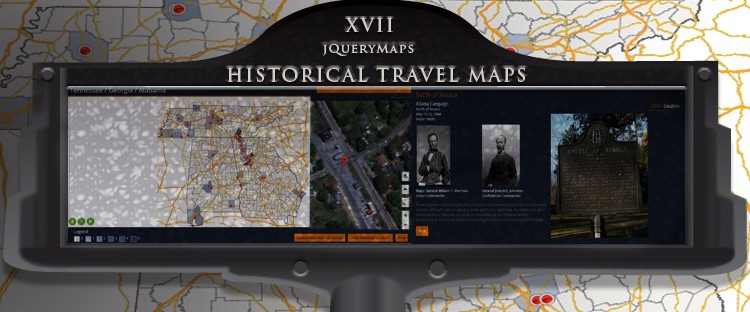
Interactive maps provide the perfect platform for displaying locations and useful information to visitors. The US holds a lot of pride in its historical past and in particular the events and battles that defined both the War of Independence and the US Civil War. Consolidating the information and linking each battle and historical event to a location on a map of the states creates an influential tool for scholars, tourists and avid historians alike. As part of a recent project, jQueryMaps partnered with a media company to provide an interactive map designed for use within a website as a tool visible to the general public. The project combines several mapping layers and navigation options down to the street level to assure visitors have the necessary resources to capture overview glimpses of landmark events along with tools to plan their next visit.
In this article we will discuss the following topics.
-
Pros to Using Both Area-Based and Street Level Maps
-
Integrating Useful Information within Dynamic Pop-Up Boxes
-
Complex Features that can be Included with Interactive Travel Maps
Consider Combining Multiple Levels on an Interactive Map
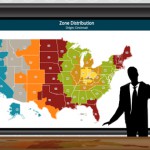
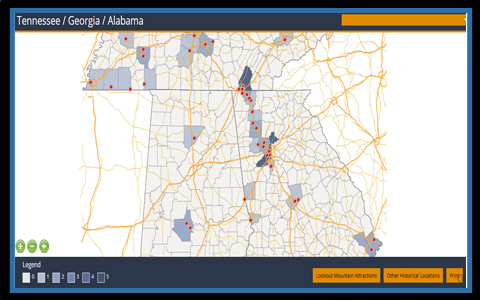
 The initial thought is more information is always better, however, while this might be true for some interactive maps, the same content can also confuse visitors, both visually on the map and within pop-up boxes. For this reason, we always recommend that projects work with multiple layers, providing increased details as the user navigates further within the project. One concrete example would be to initially provide key landmark locations on the map with labels, as opposed to directly showing full street level detail. This gives users a sense of where locations fall geographically on the map, without cluttering or distracting activity on the map. One approach for creating a simplified initial view can be seen in the following example map of the states with simple filters. The goal at this level is to allow users to choose categories and see where locations are in relation to the State or County borders, without cluttering the map with extensive detail. When an icon is selected, or in the case of larger areas, a County or Town area is selected, the map would navigate to said location and show more extensive details benefiting from either OpenStreetMap or Google Maps. The following is an interactive map with multiple layers. Clicking on a location, opens Google Map’s API within the same window and displays recreational motorcycle routes in parts of the US. The same concept is also helpful when filtering information within a map of the states with high-volume data. If the map is working with thousands of data sets, it would be cumbersome for the user and most likely slow down the performance to show all points in the initial view. A much better approach would be to layer information and cluster locations by key areas. For example, initially, the project could activate Counties where information is available and show major landmark locations. These locations can be defined in the database or generated by combining multiple icons within a single multiPOI. Once a user navigates further into the map, all of the individual icons become visible and active. This functionality works on all levels and greatly increases the usability of your web-based maps.
Displaying Dynamic Content in a map of the states
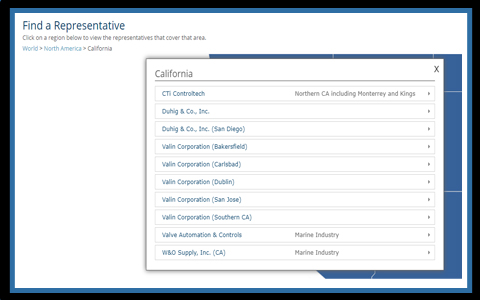 Pop-ups are normally used to show information for a specific location or area. This can include multiple pop-ups within the same project. Potentially clients would want to see specific information for areas selected, such as States or Counties in addition to location-based information for a marker on the map. Pop-ups can be fully customized, scaled and designed to meet the requirements of any project. Any number of dynamic features can be included within a pop-up, however, we recommend layering the information to avoid cluttering the initial view. Useful tools for making complex pop-up boxes more manageable include: implementing according to filters for titles, tabs filters for sections, and image scroll bars. The following example includes accordion filters within the pop-ups (California ) or larger tab filters by sections if needed. The historic sites example using the Map of the States and Google maps displays information by within a simple tab according to details or location can be seen here. The information also does not need to be confined to a fixed pop-up box, and can potentially display alongside the map or below. Once the structure and layout of the information are defined to maximize the usability of the product, the task becomes gathering the content to display. Projects, in particular maps that work with visual features, can include dynamic features like video players, image carousels, data streams and complex structures of collapsable text to facilitate user interactivity. We recommend that clients contact us for more information and review our showcase for a better understanding of the options available when deciding on a pop-up box design.
Creating Routes and Custom Features in Interactive Mapping Projects
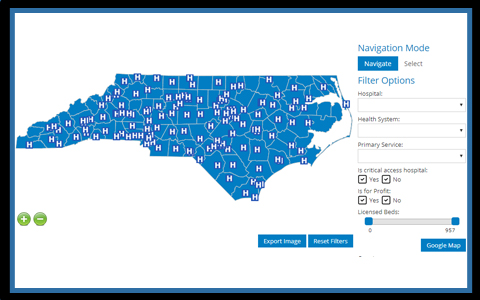
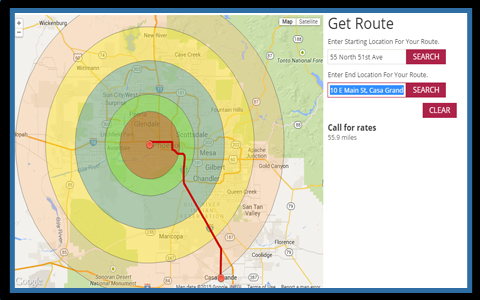
 Displaying existing data is usually the primary goal of a project, however, there are cases when a map of the states serves as a portal to define territories via a selection tool. This is often the case with map projects that reside behind a password protected page, often available to existing clients or partners of the company. The map then serves as a tool to display information, but also to select areas and store selections against the user profile for later access. This is a popular tool for companies that would like for providers to independently define and update their territories, whether for shipping rates, accessibility or to define competition. The map is a great tool to make and maintain these selections, without involving an IT department.
Another interesting possibility is to draw overlay lines on an existing map of the states. Similar to the point above, this is often used in projects where clients extend a tool to users to have them create and save information to a map. This has been used to generate motorcycle routes on a US Map combining jueryMaps with Google Maps or in the real-estate sector for realtors and even the general public to update neighborhood boundaries. In the case of this second example, overlays and lines can be combined with area-based maps in addition to Google Maps or most commonly OpenStreetMap.
 The navigation and layering of information in a well-structured manner is vital to making any mapping project user-friendly and responsive. It is important not to load too much content in any single view and avoid unnecessary cluttering with filters and multi-POI grouping. Significant customization and dynamic features can also be included with any pop-up boxes, offering ways to project information to users in a logical fashion. Contact us for more information and questions on our web-based mapping tools.
Share the post "Historic Travel Simplified with an Attractive Map of the States"