Web-based mapping solutions don’t always combine well to offer great presentation tools for business professional requiring the ability to make a map. The dynamic side of the map is designed to be streamlined and highly optimized to run efficiently on all web devices and wireless networks. Traditionally these maps are products that get embedded in the HTML of a website or intranet and would be used to transmit information primarily to viewers of the specific page on which the map was hosted. However, in many circumstances there is also a need to include highly visual static maps as part of presentation material, whether used in PowerPoint presentations or slideshows. These alternative types of maps require some of the data included in the dynamic maps with the ability to also include informative static headers and footers.
 A successful presentation transmits information to the listening public and an efficient and logical manner. As many people have strong visual learning strengths, it would only be logical to include such visual tools as components to the presentation including maps and charts. Being able to generate these tools easily is the topic of our article.
Custom Exports of Dynamic Maps
Make a Map with Multiple Locations and Custom Layout
Adding Components to Interactive Maps and Charts
What File Types are Supported with Interactive Map Exports
 Depending on the software being used to create a map for your final presentation, there may be a preference to the type of file generated when making your maps. A good solution should offer a varied number of export options, including a direct export to pdf, to JPEG, Excel or PNG for maximum quality. The same interactive map can also publish several different exports according to the topics covered in the presentation. See example of custom print button when creating a map. For example a high quality static map image could be inserted in a PowerPoint presentation as a JPEG file, but in the conclusion, an Excel export might also be useful to provide viewers with a breakdown of the specific numbers projected on the map. Any exports generated when you make a map, by default capture the map image at a given level. This enables users to create custom views of any territory. For example high data concentration areas, such as might be the case with major cities like LA or NYC can be generated at multiple levels by a simple click of a button while more rural areas would only require a single image. While the process can be conducted manually, jQueryMaps can also create a simple tool that automatically generated predetermined image sets with the click of a button. See this included in the following example export. This is particularly helpful when projects have shifting data and the views needed for the presentations are fairly fixed.
Adjusting the Layout on your Custom States Map
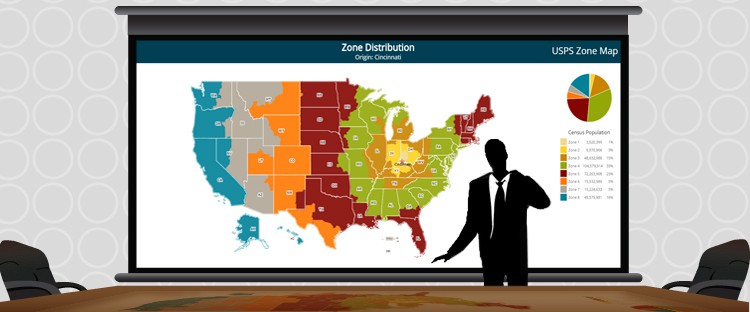
 When just a default image won’t cut it, it is very useful to have the ability to create custom image exports from a dynamic map. The tool that we presented, includes a simple export button, which captures the exact view displayed on the map. For high-density locations, perhaps in the vicinity of large metro areas, several images may be needed or a more scaled-in view is better suited for the presentation. This flexibility to choose exactly what view and zoom level is needed in the export is imperative for making a useful tool for business presentations. For projects with elaborate amounts of data, a breakdown of the numbers may also be a consideration in the export. We have designed a tool that saves the map image for default levels (such as National, State, or County) and imbeds the image within an HTML page that can then be downloaded as an image file or as a pdf. This feature essentially generates highly customized reports within seconds. The actual content in the HTML page is also fully dynamic and can include total figures tallied from the map, a chart with the total numbers by area or any other layout needed for the final reports. These custom images work great as tools to deliver quarterly business overviews or to integrate in PowerPoint presentation. Keep in mind that the data is all dynamic both on the map and within the HTML page, so information is updated in real-time once entered in the database. See an example of how to create a map with this complex export feature.
Features to Enhance your Map Maker Presentation
 We have discussed the basic features of the export tool within interactive mapping software, however any project can be customized to include additional benefits. Some of these features are embedded charts, such as line charts, pie charts or graph charts displayed alongside the exported map image or separately. The heat map and icon colors are dynamic and show statistical information visually on the map, however graphs and charts offer powerful insight as well. Combining both tools in your next business presentation will enhance the numbers behind your presentation projected on National or World Maps. Contact us to provide sample data in a spreadsheet and we would be happy to generate a demo for your review. With any project we can also integrate an export to Excel showing specifically filtered information from the larger backend database. The navigation in addition to any filters use in the map interface also provide a simple way to filter the results of the Excel export. For example in a recent project developed for a water testing laboratory, the filters by specific chemicals are extended to the export so that only information is included that was called using the map. This enables administrators to make a map and create a custom data export directly from within the jQueryMaps interface.
We hope that you will reference this article in for your next mapping making project. Keep in mind that all of the dynamic features of your map can be captured and exported in various formats to provide great business presentation content at a click of a button. Contact us for more information.
Share the post "Export Tool to Make a Map for Business Presentations"