After a grueling 2020-year, marked by tremendous human and economic loss, the world has high expectations for the efficacy of the new COVID-19 vaccines. While much public attention was given to the vetting and trial process which was expedited to provide a timely release of the vaccine, the actual distribution of the drug might prove to be equally challenging. Not only does maintaining the extreme cold-chain pose logistical problems, but ensuring the distribution of the vaccine across rural communities is essential, not to mention the delivery of the drug to less developed countries. Pharmaceutical companies and central governments are not novices at this process, commonly working together to provide yearly flu vaccines to our communities. However, the magnitude and urgency of the COVID-19 vaccination process is entirely unprecedented. It will require precise oversight to ensure a seamless network from the laboratories manufacturing the drug to the local centers that will be administering the vaccine, along with the distribution of the necessary auxiliary products required for the final administration to patients. This is no small undertaking. Specialists have been constructing plans and reinforcing supply chain networks in preparation for this task. Throughout the process, the system tracks and monitors all steps from the laboratories implanting the vaccines into individual vials to the international supply chains. The entire network is interconnected, often linking the steps with a common denominator so that each vial is accounted for and tracked to its final destination. The use of advanced IT solutions in interactive world maps can help analyze supply chains to enhance efficiency and detect limitations before they cause problems.
In this article we will look at the following topics:
-
Managing Complex Supply Chains with Custom Maps
-
Adding Layers and Filters to Interactive Maps
INTERACTIVE WORLD MAPS SHOWING SUPPLY CHAINS
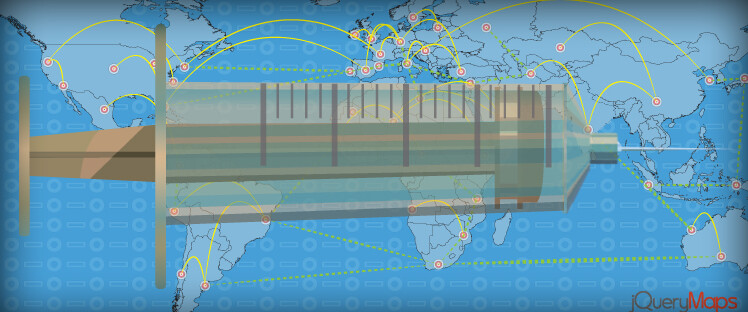
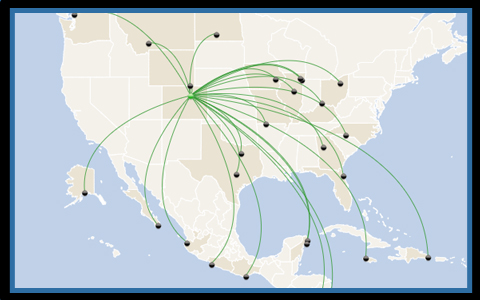 At jQuery maps, we have worked with industry-leading companies to provide solutions that assist in monitoring and improving existing supply chains. Many of these global networks span continents with several distribution hubs on the path from the source to a final destination. On these maps, the supply routes can distinguish the type of transportation used from all hubs. Each line can be shown in a different color with the option to apply filters to isolate specific categories. Hubs are shown as different types of icons of varying sizes to distinguish the locations and the points can also be sized to represent the volume of traffic that passes through any given location. These types of maps work in combination with advanced filters that enable administrators to isolate routes based on any number of criteria. For example, searches can be conducted to show the routes for a specific shipment or product showing all the stops on its trajectory to the end destination.
Users can furthermore identify problems by isolating shipments that are delayed. This gives immediate insight into potential bottlenecks in traffic in real-time. This gives the option for administrators to react preemptively to reroute traffic and thereby avoid larger delays. Most often, the data populating the maps is dynamically generated reflecting live data stored within database tables on the end client servers and refreshed frequently. The interactive world maps are an immediate reflection of the information on the ground. As the accuracy of the data is crucial to a successful project, this is an important consideration for managing logistical challenges on interactive world maps.
MAPS OF DISTRIBUTION NETWORKS WITHIN STATES
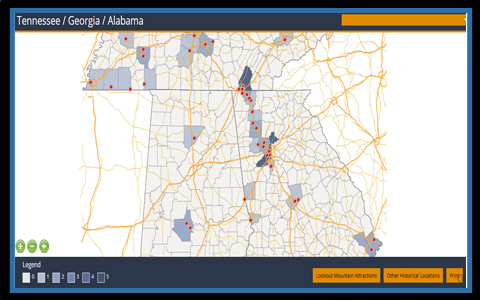 The internal distribution of products and in the case of the COVID-19 vaccine, the assurance of cold storage, is vital to the functioning of the supply chain. On a scaled back view, information can be successfully shown on an interactive world map, but once deliveries fall within a state, more granular details are required. jQueryMaps develops products that seamlessly transition from world maps to street-level detail. Neighborhood mapping is shown using Open Street Map products that can be embedded within pop-up boxes of the existing application. The experience would take users of the map from a global view to a street view with a few clicks of a mouse. Filters can also be set alongside the map to show distribution networks within cities. The details of these networks can further be displayed as overlays on the map showing specific routes, drop-off locations, and distribution hubs within a particular region. As with many jQueryMaps products, the application would include an export button that produces a quality JPEG file of all information presently shown on the map. These files are easy to reproduce, embed into presentations, or include as printed material. The actual data can also be extracted as an Excel file download, which is filtered to reflect the content of any particular map view.
Analytical tools using existing jQueryMaps software have proven useful to managing distribution networks on interactive world maps that can show global solutions while also offering drill-down options to neighborhood views.
Feel free to contact us for more information or questions regarding any of our dynamic interactive world map solutions.
Share the post "Implementing Interactive World Maps to Manage Complex Supply Chains"