If you have decided to expand your website to include a powerful jQueryMaps solution, congratulations! You won’t be disappointed with the effect this will have on visitors to your site or users of your web applications. As you move forward, there are some considerations before building your HTML5 Map. In this article we will review some of the factors that will contribute to building the perfect mapping solution.

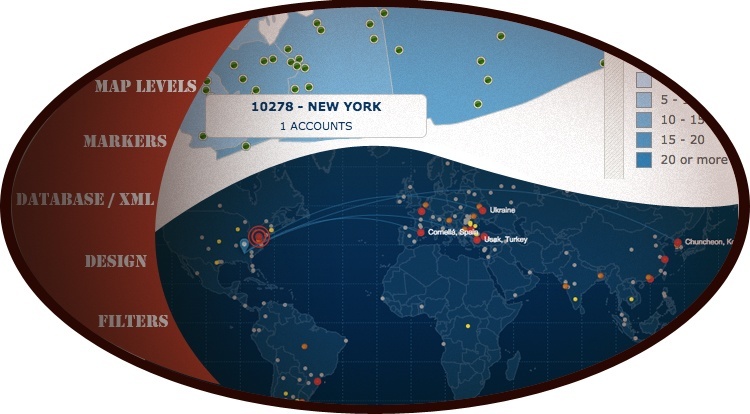
MAP LEVELS
The first task is to decide how much cartography to include with your map. More is not necessarily better since additional levels will involve more navigation clicks and may not be compatible with the data you would like to show in the project. To make this decision, first consider the data that will be accompanying your map. Is the map serving as a click-through navigation tool or are you displaying content? If so, how is your data organized (with markers or by areas) and how much information will be shown in the overall project? For example a project that will show 100 major cities in the US, should display icons at the national level and State level, but more navigation may not be appropriate. If instead the goal is to display density information by zip codes or big statistics, it would make sense to add further divisions below the State and County level. If you have any doubts, send us an email or take a look at some examples from our online showcase.

MARKERS
Once you have determined the levels to include with your project, you should probably decide whether to display icons in your project or only show area based information. Markers work very well when the data references a city or zip code and there may be multiple locations in a given area. This is often the case for locator maps displaying business locations, representatives or competitors. For other projects, the content is only organized by State or County and values can be easily included in a pop-up box without the need to display icons. This is common in many statistical maps or territory rep maps. Give us a call if you have any questions as many options are possible, including custom icons, multiple area categories and layered pop-up boxes.

DATABASE
Now that the major questions have been resolved, let us know how you would like to work with the data. Do you prefer to maintain content in an Excel spreadsheet locally or do you use a database hosted on your servers? jQueryMaps can work with any ODBC compliant database, such as MySQL, SQL Server, Access, Oracle to name a few. We will provide all of the connection strings to pull information from your database in an XML format that is read by the map. Just let us know what option you prefer and we will configure the system for you. We also handle any type of RSS data feed, XML export or even JSON data configurations.

DESIGN
This is the fun part of building your map. Do you have a clear vision for how you would like the content to display? If so we’d be interested in hearing your ideas in a brief phone consultation. You can share any images of maps you would like to replicate including custom mockups with specific colors, designs and layout. We don’t need any guidance to create a prototype of your project, but if you would like to share your ideas we can certainly include these in you map. In this section you can also tell us what content to include in your pop-up box, including any specific design you may want to follow or layout for text, images, videos, filters and more.

FILTERS
The last component, although not a necessity to your project, would be to determine whether you would like to add map filters to your project. These filters are usually oriented around the data being displayed, say filtering by a category or date range, but can also assist with the navigation. We can add a number of search tools, such as a city or zip code lookup or search for a specific element within the project.
We have many internal examples as well as an extensive selection of projects on our online showcase.

This can be a great resource for brainstorming what features you would like to include with your map and what has worked well for other companies. Partnering with jQueryMaps is a headache free solution and you can enjoy contributing to the improvement of your project with the reassurance that you are 100% backed by our technical support. As you read over these considerations remember that all of our maps are highly customizable so you can later adjust any of the settings on your end, we just make the process easier for you. We look forward to hearing from you for your next mapping project.


