There are many circumstances under which a company, organization or government entity would want to create a dynamic map on which to project information to users. Often the goal is to link maps to extensive databases in order to visualize and interpret complex information. Some projects are more unique than others and interactive world maps created by jQueryMaps have the flexibility to meet the requirements of all clients, in an optimized, highly custom mapping solution. In the article below, we will look at some of the projects that have been proposed over the years that include varying levels of customization on a world scale. The particular features of each map depend on the type of information available and the overall goal of the project.
In this article we will look at the following topics:
Interactive World Maps that use Custom Cartography and Regions
Dynamic Connecting lines for the Specific Industries
Special Maps with Neat Features and Ideas
Interactive World Maps that Work with Custom Regions
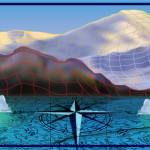
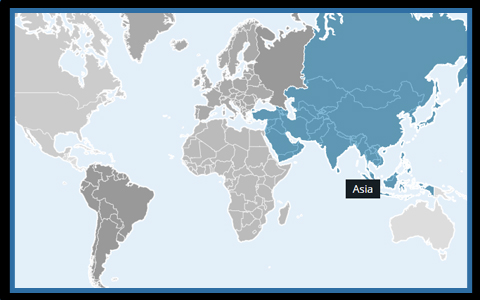 At jQueryMaps our default cartography lists commonly defined countries as recognized by reputable international entities and associates each country to their respective continental land territory. Countries can be selectable in the initial view, or navigation can be configured to pass through the Continent level before centering on a specific country. The standard representation works for most projects, however, it is also common for clients to require a personalized layout. This can be solicited to delineate non-conventional regions of the world that are just forming or have not been recognized internationally as sovereign nations. It can also be used to merge countries on the top-level so that grouping by continents is replaced by custom regions. One area where this is particularly common is the Middle East, whereby projects that focus on this region prefer to isolate the select countries. Another common example is to separate the Carribean and Central America from North America to make the regions selectable from the World view. As described above, working with interactive world maps is a powerful solution that can be tailored for any specific project, including generating custom regions at a granular level within sovereign countries or by grouping countries at the top-level to replace association by Continents. To implement this type of customization is fairly simple and our team would work closely with your company. We can provide you with a list of the default country to continent association and you can adjust the information to create your own regions or redefine existing regions. At a lower level, if a project requires outlining sections of a country or territories that extend beyond conventional country boarders, we would work alongside your team to produce the graphics that represent these territories and subsequently implement them into your custom map.
Implementing Custom Features and Connections on your World Map
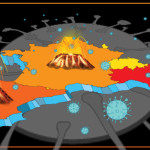
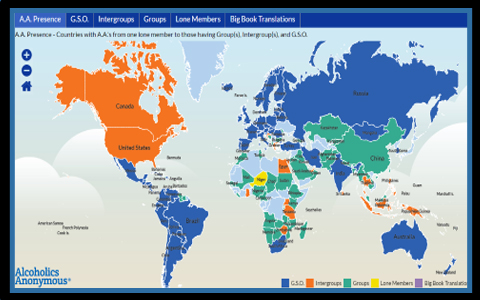 There are numerous ways that dynamic data can be displayed within a mapping project. The conventional methods would be to display information based on how the information is structured, typically grouped by country, continent, city or geocode. According to the amount of data involved, listings can be shown individually or grouped to only show aggregate results. For example, if a company is projecting international sales of a product, they can breakdown the information by store, although depending on the number of locations, it may be more practical to only show results on the map by city. Sub-level data, even if not shown on the map, can always be extracted within the project and displayed on custom results tables below the map or within expandable pop-up boxes. In some instances, the actual connections between points are more relevant than the start and endpoint of the connection. This can be the case with travel-specific maps or custom maps. In these circumstances, it is important to show the connection between points and make the connecting lines dynamic so that they are selectable and convey information to users. The lines can have different stroke widths, colors or forms depending upon backend data and specific content can be shown both below the map as a tabular form in addition to within pop-up boxes that are called whenever a line is selected. For complex projects that include many data points and lines, a sophisticated system of filters can be implemented so that users can isolate connections for specific types of data. This can be applied for any type of project and adjusted for your company’s specific needs.
Interactive World Maps with Interesting Features
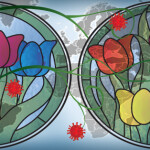
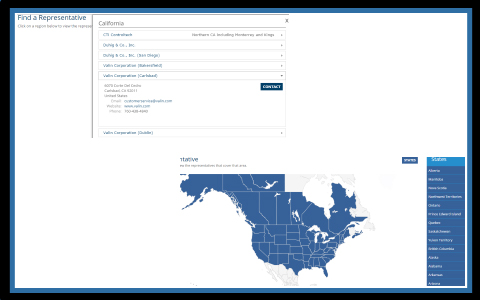 Whether the requirement comes for a specific need or the desire to create something original, it is always a welcomed challenge at jQueryMaps to create custom features for clients. Over the years, we have had numerous such requests and often these ideas are floated and implemented in tandem with a company’s design team. We can replicate existing features or design our own depending on the specific details. Some of the interesting features we will discuss are accordion pop-up box outlines, heat-maps, and spiral multi-pois. The first request was part of a project that included large amounts of text data for individual locations. The information was very extensive and the goal was to display the content to users organized by categories and sub-divide the categories by headers. The end product was a custom pop-up box that displayed predefined tabs on the top of each pop-up with the major categories for each location. Individual tabs, when selected then contained cascading titles of the sub-topics, which would be expanded or contracted by selecting the down arrow. The end result was an efficient tool that enabled users to digest multiple pages of content and scan information with a few clicks of a mouse. The second feature that we are discussing is the implementation of heat-maps as an overlay on a World map project. This feature is customarily reserved to interior spaces, however, the same technology can be scaled back to show the movement of features on a map through historical GPS data shown through heat-maps.
 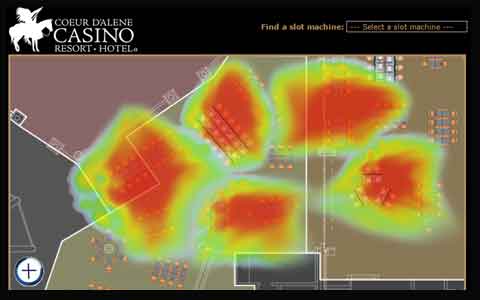 This can be applied to convey the intensity of traffic on shipping networks, trading routes or any large data collection that is associated with moving GPS coordinates. The resulting heat-maps can be called through drop-down filters by category or time period. The final feature is a variation of our multi-poi tool which is used to consolidate multiple entries located in the same coordinate or in close proximity of one another. Instead of showing the information as overlapping points, some users like the cleaner look of using distinct icons to represent these plural datapoints. The multi-poi can be arranged as a list of the individual entries within a location or some designs prefer a spiral view that continuously expands as new entries are added. The result is both sleek in appearance and highly functional to users.
As with all of our projects, we welcome and count on your feedback and requests. Contact us for a free consultation regarding your next interactive world map project or for more information about our solutions.
Share the post "Unusual and Dynamic Interactive World Maps of Countries"