The energy sector includes a broad number of sub-sectors, which is being diversified further with the expansion of new renewable energy sources. Over the years, jQueryMaps has collaborated with many clients from the energy sector across a number of different industries, including solar energy, wind energy, natural gas and more.
Each company is unique in its requirements for using a map to showcase industry specific data. In some cases projects are straightforward, implemented to show where existing facilities are located. Facilities can include different categories of processing plants, offices and distribution centers. Each category can display a distinct icon and include varying amounts of information in the pop-up boxes. This was the case for the sPower project created to display solar energy projects around the country. See example. 
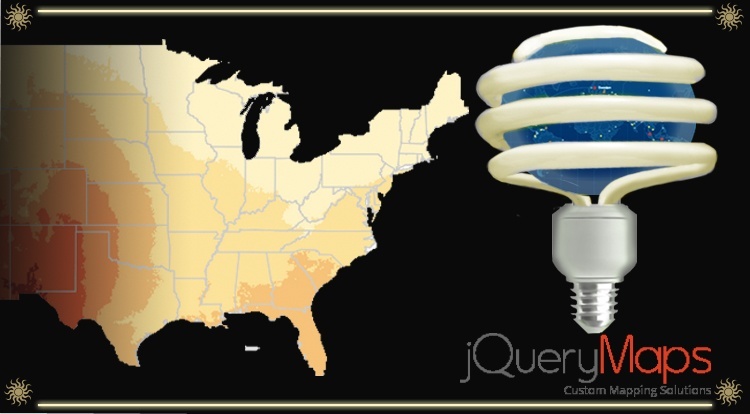
More advanced projects have included the overlay of GIS data to show new potential harvesting locations. In the case of wind or solar energy, these overlays can display wind speed or sun intensity through a GIS map that is overlayed on jQueryMaps cartography. The map project created for the NationResourceDefenseCouncil is a good example of how wind images were implemented to enhance a States and County map.

We have also worked with clients that divide the US into either company specific and/or industry specific territories. These custom divisions can be implemented based on any existing image or list of areas. The result is a map tailored for a specific industry that better conveys information to internal employees. Several examples are available, but PIKE Corp stands out for the territories that were implemented. See example.
Other tools that have been used is the placement of dynamic objects on the map that represent basins and pipelines. This was produced for Spectra Energy in a prototype to display supply pipelines around the Country and processing stations along each line. The lines and stations within, all contain real-time information that can be set to update as maintenance schedules are placed along the route. Any map can then be used to generate high-resolution image exports to use within pamphlets, publications or other parts of the website. 
Information can also be shown by areas as totals for consumption of energy within a State or Province. In the project created for the Canada National Energy Board, the map simply provided a user friendly way to see aggregate values of energy generation within different sectors, such as hydro, nuclear and renewable sources. See example.
Contact us by phone 1-866-392-0071 to speak to our experience project managers for any questions you may have on your upcoming project.
Share the post "jQueryMaps – HTML5 Mapping Solutions for the Energy Sector"